
Energy Supply
Energy Supply
Production covers about 94% of lignite and 76% of gas consumption (2021). Since 2015, the capacities of wind and solar have remained the same.
Resources There are a lot of energy resources available. Natural gas reserves are diminishing (from nearly 390 bcm in 1990 to 77 bcm in 2021). The volume of oil reserves is 82 Mt. The nation has a sizeable hydroelectric potential (estimated at 70 TWh). With 280 Mt, proved reserves of lignite are likewise sizeable.


Electricity
The nation has an installed capacity of 18.5 GW, of which 36% are CO2-free (wind, solar, hydro, and nuclear) and 16% are CO2-free (hydro, coal, gas, and biomass) (end of 2021).
Using Canadian heavy water technology (Candu), Romania currently operates two 650 MW nuclear reactors at the Cernavoda facility. The reactors were put into service in 1996 and 2007, respectively. CHP is a well-developed technology that accounts for roughly half of the world's thermal power capacity (2.8 GW in 2020).
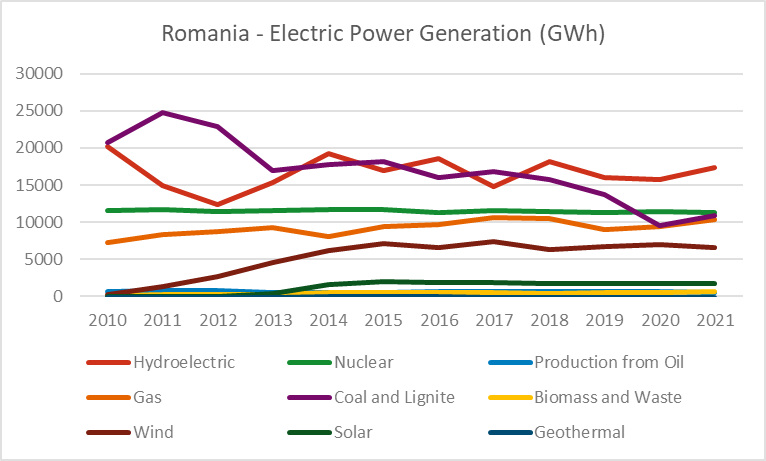
Between 2010 and 2014, wind capacity more than doubled, rising from 460 MW to 2.8 GW (when the final phase of EZ's 600 MW Fantanele-Cogealac wind park was completed). Since then, wind installation has gradually increased, reaching 3 GW in 2015. Since then, its capacity has remained essentially steady. Solar installations increased significantly in 2013 (+1.1 GW), but only 264 MW have been added since then. After falling by 14% in 2019 and 2020, power generation increased by 6% to 59 TWh in 2021. Between 2014 and 2018, it remained essentially constant at 65 TWh.
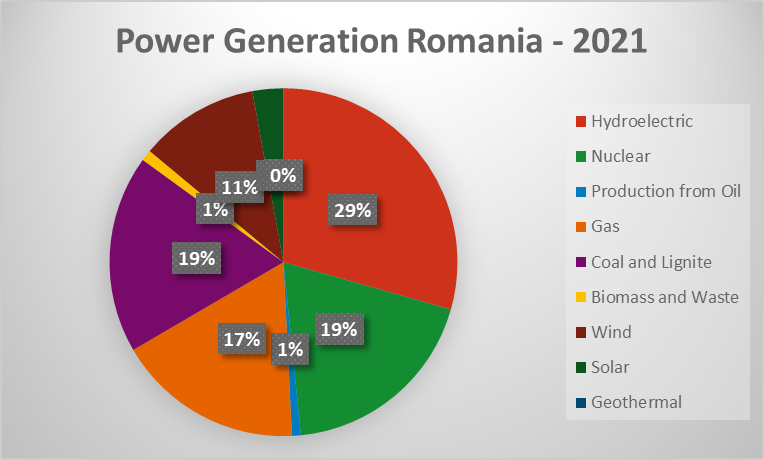
62% of the energy mix in 2021 was CO2-free (29% from hydropower, 19% from nuclear, 11% from wind, and 3% from solar). Between 2011 and 2019, the proportion of coal and lignite decreased by 23 pp, then rose to 19% in 2021. Since 2010, the percentage of gas has climbed by 5.5 pp, reaching 17% in 2021. Between 2011 and 2015, there was a dramatic increase in wind and solar energy, making up more than 10% of the electricity mix. Hydropower generation fluctuates (up 22% in 2018, down 12% in 2019, up 8% in 2020, and up 5% in 2021).
Source: www.enerdata.net
Last update: 07 2023