
Energy Demand
Approximately 0.8 toe, or 73% less than the EU average in terms of consumption per person, including nearly 2 400 kWh of electricity, which is 57% less than the EU average (2019).
After experiencing a significant increase between 1995 and 2005 (+5%/year) and slower growth until 2017 (+0.7%/year), global energy consumption has been modestly declining since 2017, reaching 2.3 Mtoe in 2019.
Oil (52% of the total in 2019, primarily for transportation) and hydropower (almost 29% of the total) provide most of the world's energy needs. Since 2010, the share of biomass has fluctuated at about 12%, while that of coal and gas has remained negligible (6% and 1%, respectively).
Since 2010, the final energy usage has averaged 2 Mtoe (2.1 Mtoe in 2019). Between 1997 and 2010, it grew incredibly quickly (+6.9%/year). Oil accounted for 55% of total energy consumption in 2019 (up from 59% in 2010), followed by electricity (24% in 2010), biomass (13% in 2010), and natural gas (25%). Between 1990 and 2000, the shares of coal and gas fell precipitously, presently insignificant (6% for coal and less than 1% for gas in 2020).
Albania's energy demand has been increasing in recent years, driven by economic growth and population increase. The country's primary energy demand is met through imports of oil and gas, while electricity is mostly produced domestically through hydropower. Albania's energy consumption per capita is relatively low compared to other European countries, but there is potential for further growth in energy demand as the country continues to develop. The government is working to improve energy efficiency and promote the use of renewable energy sources to meet the growing energy demand in a sustainable way.
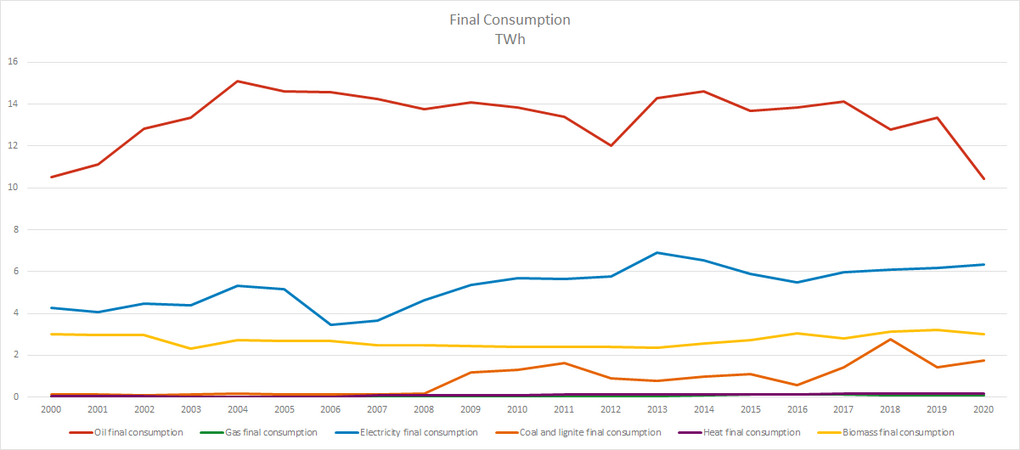
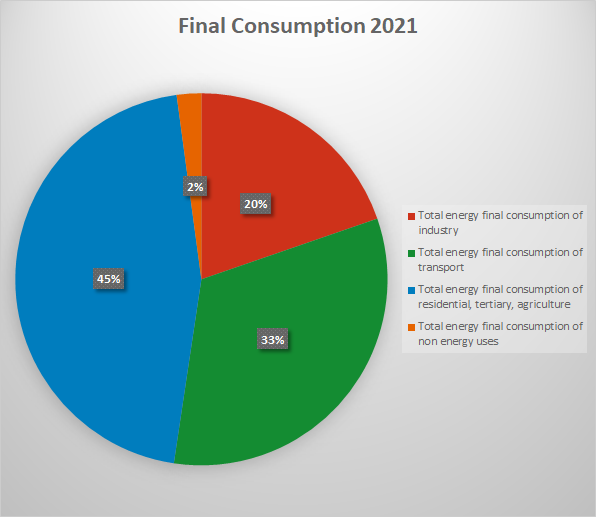
Compared to 2010, the percentage of transportation in final consumption has significantly increased, and it currently outpaces homes and services (45% in 2020 vs. 40% in 2010). Since 2010, the industry's share has dropped from 23% to 20% in 2020. (including nonenergy uses). According to preliminary data, since 2010, there has been an increase in electricity consumption (+4%/year), which is expected to reach 8.4 TWh in 2021.

Source: www.enerdata.net
Last update: 07 2023